Chart of the Day - November Soybeans
The information and opinions expressed below are based on my analysis of price behavior and chart activity
Tuesday, June 17, 2025
If you like this article and would like to receive more information on the commodity markets, please use the link to join our email list -Click here
Every morning, at about 8 AM CST, I post a short video highlighting where I see opportunities in the futures markets. You can view my most recent video here
November Soybeans (Daily)

Today, November Soybeans close at 10.673/4, up 7 ¼ cents on the day. Friday’s “surprise” announcement of biofuel standards gave a strong technical boost to the futures, and this week that strength has continued. Today’s settlement was also the highest we’ve seen since February 4th. If you look back to that time, you might notice that purple 200-day moving average acted as strong resistance. Currently, we’ve been trading above that average for about a month, give or take, with most of the days being above that average since May 12th. 16 closes above the average and 9 below, since then. I think that’s a positive sign of longer-term tend shift. Friday’s trade activity put prices right against a trendline, drawn off the highs in Nov ’23 and May of ’24, and this week has seen consecutive closes above that. That may be another signal of trend change. I would see support below the market at 10.50 (big, round number) and at the 5-day average (blue, 10.47 7/8) and the 10-day (red, 10.39 5/8) Those moving average crossed into Bullish territory a week ago and are pointing higher. Nearby support could be found against the May 14th high of 10.65 ½. Resistance I might see at or near the February high of 10.75 ¾ and from there to 11.00 or last September’s high of 11.04 ¼. Aggressive and well-margined traders may do well to consider long positions in the futures. Producers should be looking to use this rally to get a little more hedged, seeing as we’re above the Feb “insurance price” of 10.52 ½. I wouldn’t hedge using futures, just yet, but some bearish Put option strategies could be wise. Call me directly, if you need suggestions. Given the additional consumption/usage for Bean Oil in biodiesel and other biofuels, along with the reduced acreage, this market is shaping up to be different than last year!
If you like what you’ve read here and would like to see more like this, please Click here and sign up for our daily futures market email.
Every morning, at about 8 AM CST, I post a short video highlighting where I see opportunities in the futures markets. You can view my most recent video here
November Soybeans (Weekly)
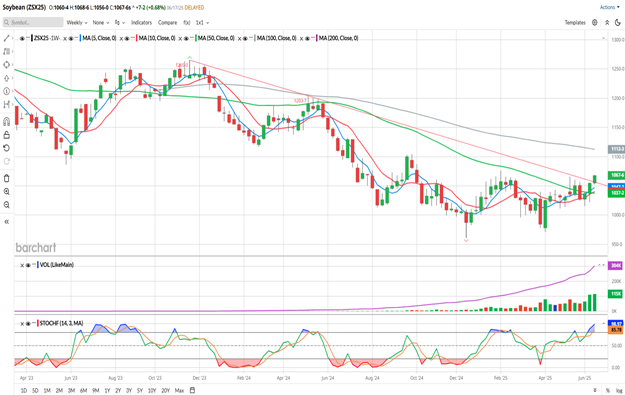
So far this week, November Soybeans are up 13 cents, as of Tuesday’s close. While it hasn’t been making huge moves, this chart seems to indicate that the medium-term trend has shifted to the bullish side. Since this market made its low in December, the Beans have been working higher, although perhaps not at a rate that most would like. The 5- and 10-week moving averages crossed into bullish territory in late April or early May, depending on how you look at it. Currently those averages are 10.47 ¼ (red) and 10.40 (blue) and are pointing up toward higher prices. Before this week, November Beans have traded both sides of the 50-week moving average, as the market fought for direction. Last week this contract managed a close above the 50-week average and this week it seems to be extending a bit more. Today that average (green) is at 10.37 ¼, some 30 cents under the price. I know it’s only Tuesday, but if the week ended here, this would be the highest weekly close since the last week of September ’24. You may notice that there is a red trendline on this chart, drawn off of the highs from November of ’23 to May of ’24. We’re trading above that trendline now, and as long as we can stay above it I feel that’s a good sign. There may be some overhead resistance near the February high of 10.75 ¾ and the perhaps to last September’s high of 11.04 ¼. The 100-week average (grey) at 11.12 3/8 may also serve as a resistance target. The Stochastics on the bottom subgraph has entered overbought status over the past 10 days. Looking back over time, you ‘ll notice that the markets can often stay overbought/oversold for extended periods. According to Barchart’s Seasonal Data November Soybeans typically stay firm and head higher though June, July and August. We’ll have to stay tuned to see if that hold true for 2025.
If you like what you’ve read here and would like to see more like this, please Click here and sign up for our daily futures market email.
Every morning, at about 8 AM CST, I post a short video highlighting where I see opportunities in the futures markets. You can view my most recent video here
Jefferson Fosse Walsh Trading
Direct 312 957 8248 Toll Free 800 556 9411
jfosse@walshtrading.com www.walshtrading.com
Walsh Trading, Inc. is registered as a Guaranteed Introducing Broker with the Commodity Futures Trading Commission and an NFA Member.
Futures and options trading involves substantial risk and is not suitable for all investors. Therefore, individuals should carefully consider their financial condition in deciding whether to trade. Option traders should be aware that the exercise of a long option will result in a futures position. The valuation of futures and options may fluctuate, and as a result, clients may lose more than their original investment. The information contained on this site is the opinion of the writer or was obtained from sources cited within the commentary. The impact on market prices due to seasonal or market cycles and current news events may already be reflected in market prices. PAST PERFORMANCE IS NOT NECESSARILY INDICATIVE OF FUTURE RESULTS. All information, communications, publications, and reports, including this specific material, used and distributed by Walsh Trading, Inc. (“WTI”) shall be construed as a solicitation for entering into a derivatives transaction. WTI does not distribute research reports, employ research analysts, or maintain a research department as defined in CFTC Regulation 1.71.